
Tropical cyclones & climate change : a review
- CATRisk Consultants

- 18 jul 2020
- 5 Min. de lectura
Actualizado: 31 dic 2020
A review of the science on the relationship between climate change and tropical cyclones (TCs) is presented. Topics include changes in aspects of tropical climate that are relevant to TC activity; observed trends and low-frequency variability of TC activity; paleoclimate proxy studies; theoretical and modelling studies; future projections; roadblocks to resolution of key issues; and recommendations for making future progress.
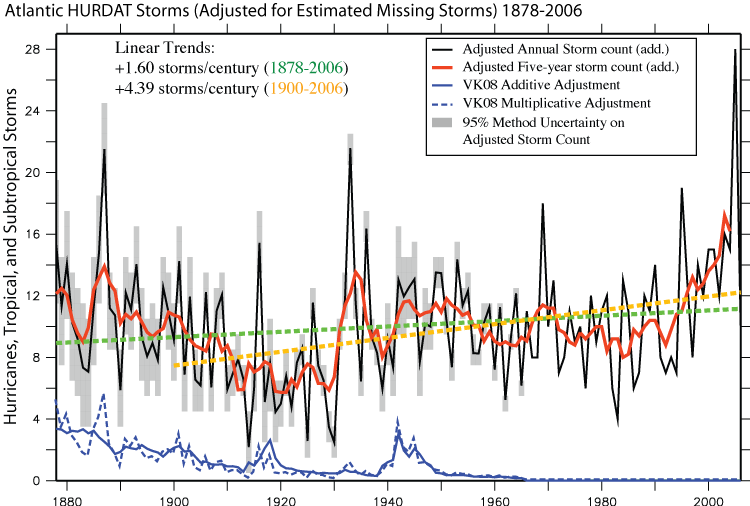
Atlantic Hurdat storms 1878-2006
Time series of Atlantic TC counts, Red line is the 5-yr running mean adjusted storm count. The solid blue line is the adjustment applied to the data (the estimated number of missing storms each year), while the dashed blue line is a sensitivity case requiring one ship/storm encounter for detection instead of two, as in the base case. The green and orange solid lines are linear trend fits to the data for 1878–2006 and 1900–2006, respectively. Black shading indicates the two-sided, 95% method uncertainty, estimated from the probability density function of the estimated adjustments.


Introduction
This report reviews the current state-of the-science on possible relationships between climate variability and change and tropical cyclone (TC) activity on different time scales. The emphasis here is on multidecadal variability and longer time scale changes, including possible anthropogenic influences on tropical cyclone activity. The present report is not a scientific assessment of anthropogenic influence on TCs, as we do not present likelihood statements on various key issues, as is done for example in the IPCC (Intergovernmental Panel on Climate Change) assessments.
Tropical Atlantic Warming: Natural Variability vs. Anthropogenic Forcing
Based primarily on climate model assessments, there is increasing evidence that sea surface temperature increases in tropical cyclone basins, as reported in several studies (e.g., Emanuel, 2005a; Webster et al., 2005), are at least partly a response to long-term increases in greenhouse gas concentrations.
For example, Santer et al. (2006) find that observed SST increases in the Atlantic and North Pacific tropical cyclogenesis regions during the 20th century are unlikely to be due solely to unforced variability of the climate system, but are more realistically simulated in experiments using estimated historical climate forcing. Their internal climate variability assessment and external forcing results are made more robust by their use of 22 different climate models and two observed SST reconstructions.
Using the models for which individual forcing experiments were available, they find that the human-induced change in greenhouse gas forcing is the main cause of the 20th century warming, and particularly of the late 20th century warming.
The anthropogenic forcings in these experiments included changes in well-mixed greenhouse gases, ozone, and aerosols, as well as land use change, whereas natural forcings included solar variations and aerosols from volcanic eruptions.
For the tropical North Atlantic, the roles of naturally occurring oscillations versus radiative forcing variability and trends on tropical Atlantic SSTs have also been evaluated using statistical modeling approaches. Goldenberg et al. (2001) proposed that a naturally occurring oscillation of the climate system, termed the Atlantic Multidecadal Oscillation (AMO), was responsible for pronounced multidecadal variations in Atlantic major hurricane counts since the 1940s.
They noted that major hurricane counts covaried with fluctuations in both an AMO index derived from detrended SST data and with vertical wind shear in the Main Development Region (MDR, a term they used to describe the tropical Atlantic and Caribbean Sea region between 10◦ and 20◦N).
Mann and Emanuel (2006) suggested an alternative interpretation by noting that late summer SSTs in the Atlantic MDR closely track, on long time scales, surface temperatures averaged over the entire Northern Hemisphere, with substantial warming over the 20th century. Using a statistical modeling approach, they suggested that most of the low-frequency (multidecadal) variation and warming trend in MDR SSTs had been produced by changing radiative forcing, as opposed to being part of a naturally occurring oscillation.
They showed, using a statistical regression approach, that the evolution of summertime tropical North Atlantic sea surface temperature through the 20th century can be represented as a combination of global mean surface temperature and sulfate aerosol forcing, which is concentrated mostly in the northern hemisphere. In general, the climate forcing from aerosols, including their indirect effects via clouds and precipitation processes, is much more uncertain than the forcing due to increasing greenhouse gases (e.g., IPCC 2007).
Conclusions of study
Several previous assessment reports contain specific statements on possible anthropogenic influence on TCs. One such assessment (Henderson-Sellers et al., 1998) concluded:
(i) there was no clear evidence for long-term trends in TC activity;
(ii) the potential intensity (PI) of storms would remain the same or increase by 10–20% (in terms of central pressure fall) for a doubling of CO2) although uncertainties remained with PI approaches;
(iii) little could be said about the future distribution of intensities or about future frequencies of TCs; and
(iv) the broad geographic regions of cyclogenesis and of occurrence of TCs were unlikely to change significantly. A 10–20% increase in central pressure fall would correspond to a smaller (roughly 5–10%) percentage increase in terms of maximum surface wind speeds.
There is no evidence from any models to date that the region of TC formation (e.g., Knutson et al., 2008) or strong tropical convective activity (e.g., Dutton et al., 2000) increases dramatically as the area of oceanic regions with SSTs larger than 26–27◦C expands due to greenhouse warming. Rather, model results (e.g., Knutson et al., 2008) suggest that the apparent threshold for TC formation (as diagnosed empirically for the present climate) is actually a climate-dependent threshold, which rises roughly along with the tropical mean SST increase in greenhouse warming experiments
Saunders and Lea (2005) and Elsner et al. (2000; 2006) find statistical links between U.S. landfalling hurricane activity and large-scale circulation anomalies, although long-term climate trends in their predictors have not been firmly established. Elsner and Jagger (2008) report a significant statistical relationship between U.S. and Caribbean hurricane activity and solar activity as inferred from sunspot numbers.
Computer climate models, like the one from which this sea surface temperature animation was derived, are powerful tools used to improve our understanding of our planet's climate and how it varies on seasonal, annual, decadal, and centennial time scales. Though this dataset only displays model-simulated sea surface temperatures, global climate models consist of a set of interconnected three-dimensional numerical ocean and atmosphere models, as well as models of sea ice and land surface processes. See http://www.gfdl.noaa.gov/climate-modeling for more background information on climate modeling. The model used in this dataset is the GFDL CM2.5v1, produced by NOAA GFDL 's Climate Change, Variability and Prediction Group.(https://www.gfdl.noaa.gov)

The Nature of the Sun’s Influence on Climate Change
The sun’s magnetic field wrapped within the solar winds is a major force driver modulating natural climate change on Earth. The solar influence affects ocean cloud creation and sea surface temperature. The relationship between ocean surface temperature and the strength of the sun’s magnetic field is best fitted using a natural logarithmic function of the AA Index.


Comentarios