
Hurricane vulnerability module
- CATRisk Consultants

- 1 ene 2021
- 3 Min. de lectura
Actualizado: 3 ene 2021
Peril Vulnerability Module is a key component of risk modeling. It relates scientific hazard distributions (e.g. North Atlantic basin Hurdat tropical cyclone frequency distribution catalogue) by assigning asset or building estimate loss for different primary or secondary characteristics at a given site or latitude/longitude geocoded location. Losses are then grouped for portfolio aggregation and financial conditions applied.

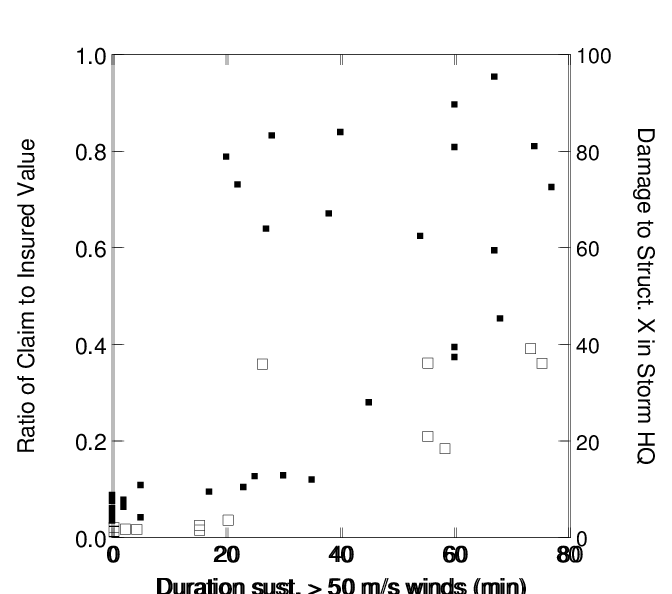
Wind vulnerability modeling calculates assessment of physical damage, to the built environment. Given an event, the RMS U.S. Hurricane Model estimates hazard present at a location of interest, in terms of the peak gust wind speed. Damage is measured in terms of mean damage ratio (MDR), defined as the ratio of the cost to repair a building to its replacement value.
The vulnerability of a portfolio of buildings to winds is expressed by functions, which are also known as vulnerability curves or damage curves. these represent a relationship between the peak gust wind speed and the MDR for buildings, contents, and their resulting loss of use.
RMS Risklink application software U.S. Hurricane vulnerability model was updated in version 6.0 by conducting extensive data mining studies on high resolution insurance claims from recent hurricanes, including Charley, Frances, Ivan, and Jeanne. Hurricane vulnerability functions were derived using a comprehensive claims database that includes a total of $8.2 billion of losses from residential buildings and $4.9 billion of losses from commercial buildings. It should be noted that the wind vulnerability curves for the U.S. Hurricane Model do not incorporate the impact of storm surge or wave action; these are modeled separately as secondary perils, described in ―Secondary Peril document: Storm Surge.


The vulnerability of a building, its contents, and time-dependent losses, such as those associated with additional living expenses (ALE) and business interruption (BI), are defined in terms of the five primary characteristics and a set of 25 secondary characteristics. The five primary characteristics are: § Occupancy type § Construction class § Year of construction § Number of stories § Square footage (residential only).


EXPOSURE DATA
The resolution and quality of the exposure data have a direct impact on the accuracy of the vulnerability calculations or risk analysis, as either actual information or assumptions must be provided to the model.
• Hurricane modelling generally assumes a global climatic system that was stationary over the last 100 years. If, however, ocean water temperatures are slowly increasing, this assumption may not be accurate. The current methodology will not reflect the impact of such a potential warming of ocean waters. Warm or cold multidecadal oscillation series are often available and long-term probabilities updated.
• Conditional analyses - modelling estimates that consider differences between specific years (such as El Niño and La Niña years) - are not typically included by modelling firms. Scientific studies of hurricane formation in the Atlantic suggest a negative correlation with El Niño years, and potentially a positive correlation with La Niña years.
• It is important to understand what data have been included in the loss estimate and which have not, and if they agree with the insurance contract. This relates in particular to fire following earthquake and storm surge.
• Demand surge describes temporary inflation after a major catastrophe resulting from increased demand for building materials, repair work. Loss adjustment expenses and operational costs incurred by the primary insurer in connection with the increased volume of claims' settlements. These post-event effects are typically applied in the form of factors to the loss estimate. Demand surge is expressed as a percentage of the regional or country gross domestic product loss distribution.
Source: RMS Risklink Hurricane vulnerability documentation on rms.com


Comentarios